
All content Copyright 2022 Parallel Systems Ltd.
Reference Schematic:
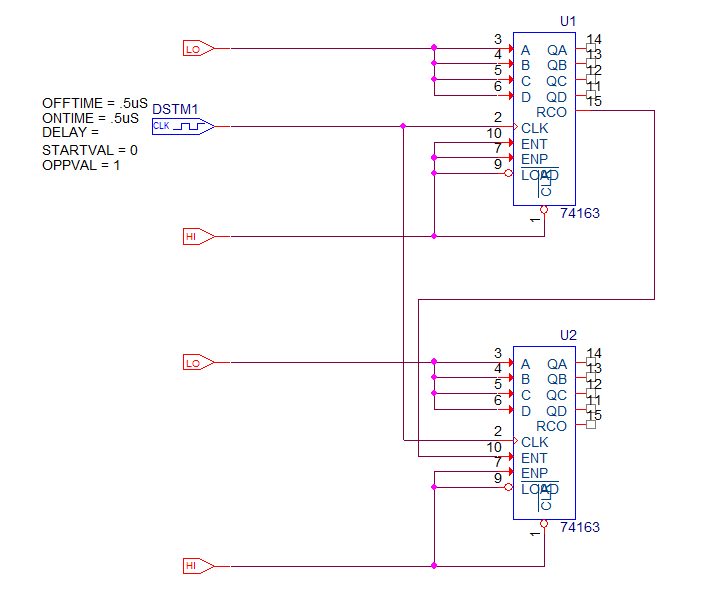
1. Open the provided Counter project.
This uses the 74163, $D_HI, $D_LO and DigClock parts.
2. Check the DigClock properties: OFFTIME: .5u, ONTIME: .5u, DELAY: 0, STARTVAL: 0 and OPPVAL: 1.
(Equivalent to 1MHz, 50 / 50 duty cycle)
3. Define a new simulation profile with a transient analysis set to run to time 500u seconds.
4. In the Simulation profile, left-click Options.
5. Left-click General under Gate-level Simulation.
6. Change the drop-down for DIGINITSTATE from X to 0 to initialize all flip-flops to 0.
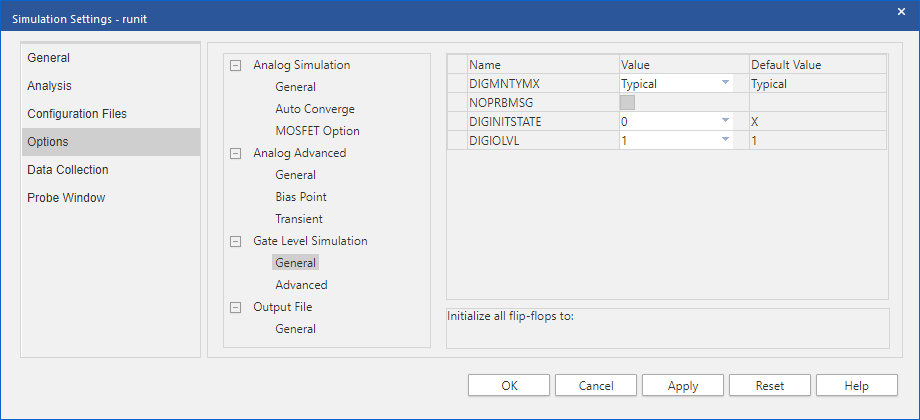
7. Left-click>Apply and left-click>OK.
8. Save the file.
9. Run the simulation.
10. In the Probe window, left-click the Add Trace toolbar button.
11. Uncheck Aliases Names so that Digital is the only Simulation Output Variable type selected.
12. Left-click on U2:QD, U2:QC, U2:QB, U2:QA, U1:QD, U1:QC, U1:QB, U1:QA, U1:CLK and left-click>OK to add the traces. You should see the display pictured below. You can see that with every rising clock edge, the counters are toggling. You can use the scroll bar at the bottom of the screen to display later times in order to see that the second stage is working. Once the counter reaches 255, it resets to begin again at 0.
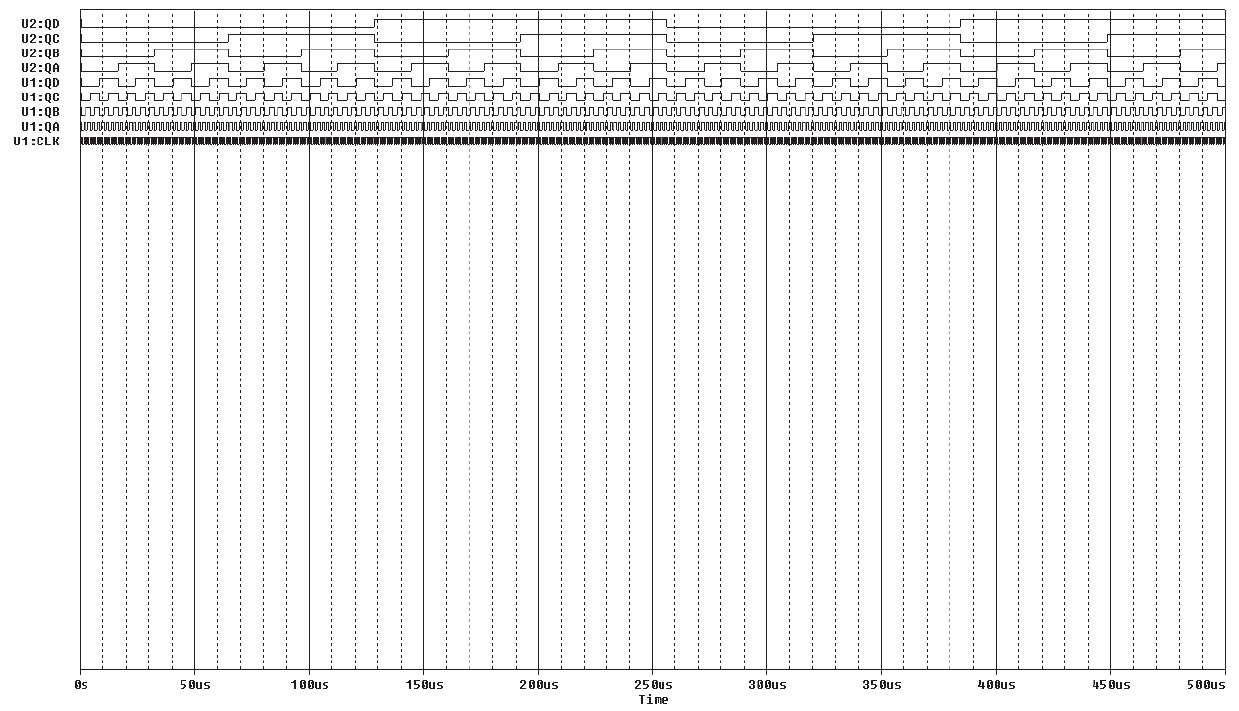
You can verify that the circuit is working as expected with this display, but there is another way of looking at the results, instead of looking at individual traces, you can look at the outputs as a decimal bus.
13. Left-click>Add Trace again.
14. Left-click each of the signals U2:QD, U2:QC, U2:QB, U2:QA, U1:QD, U1:QC, U1:QB and U1:QA.
15. Then edit the Trace Expression field to read as follows: {U2:QD, U2:QC, U2:QB, U2:QA, U1:QD, U1:QC, U1:QB, U1:QA};Qbus;d
(Enclosing the signal names in curly braces tells Probe that this is a bus definition. Qbus will be the displayed name for the bus, and the “d” at the end specifies the display format, which is decimal for this example)
16. Left-click>OK to display the bus.
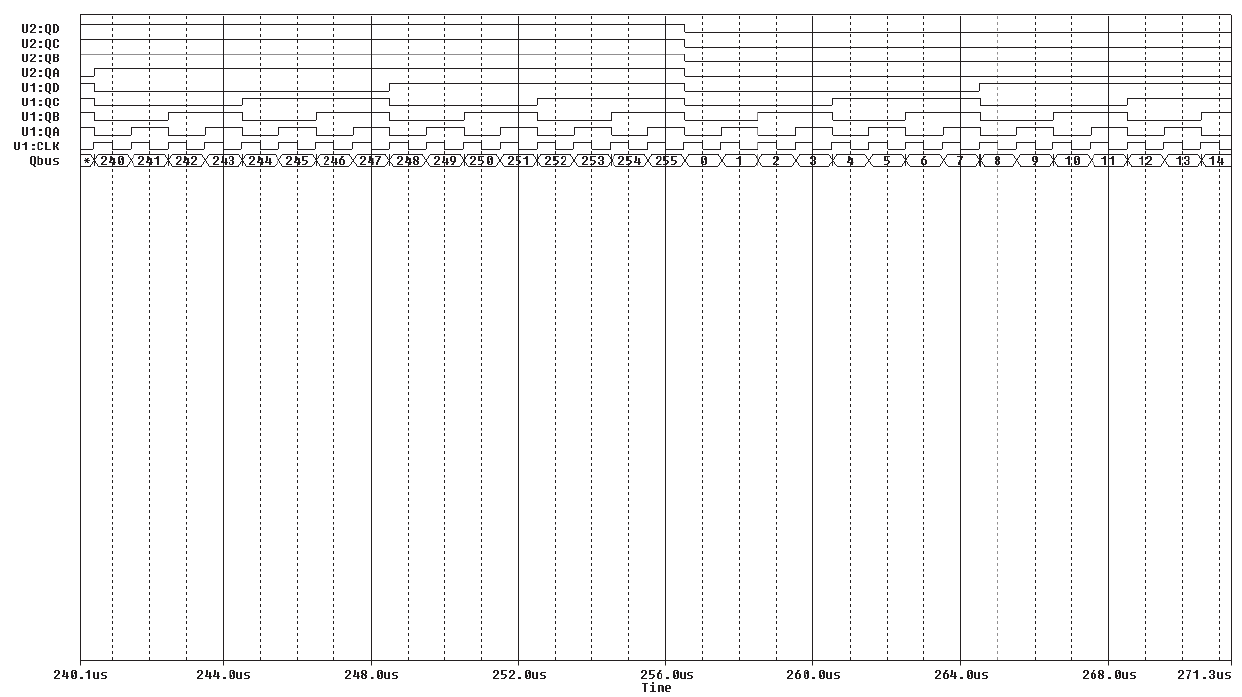
The bus is added at the bottom of the display. You can compare the bus values with the individual traces above. If you scroll to the right, you may find that the value of the bus is “*”. This means that the bus segment is not wide enough to display the value. You can left-click on the Zoom In toolbar button to increase the resolution.

End of Lab
All content Copyright 2022 Parallel Systems Ltd.