
All content Copyright 2022 Parallel Systems Ltd.
Reference Schematic:
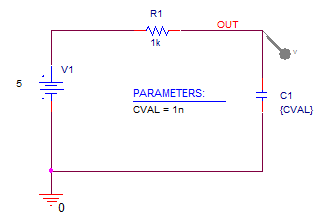
1. Create a new PSpice project called Measurements based upon the empty project template.
(This will create Measurements.opj.)
2. Open the schematic page and enter the design shown above.
3. Configure a transient analysis simulation profile running to 10uS and add a parametric analysis that sweeps CVAL from 1n to 10n in 1n increments to it.
4. Set the IC attribute to 0 on the capacitor.
(If you do not set an initial voltage across the capacitor, then the capacitor will be seen as an open circuit during the bias point calculation. V(OUT) will be set to 5V, which will then be used as the starting point for the transient simulation.)
5. Run the simulation.
6. When the Probe window opens, left-click>OK to display V(OUT) for all sections.
7. Choose Trace>Performance Analysis from the top menu.
The Performance Analysis dialog opens showing ten data sections available, the parameter CVAL as the swept variable with values ranging from 1nF to 10nF.
8. Left-click the Wizard button to run the Performance Analysis Wizard.
9. In the Performance Analysis Wizard – step 1 of 4 dialog, left-click the Next button to continue through the wizard.
10. In the Performance Analysis Wizard – step 2 of 4 dialog, scroll down the list of measurements on the left.
11. Left-click>Risetime_NoOvershoot to select it. This will provide a detailed description of the measurement.
12. Left-click>Next.
13. In the Performance Analysis Wizard – step 3 of 4 dialog, left-click the Add Trace button next to the “Name of trace to search” label to be presented with the list of available traces.
14. Left-click on V(OUT) from the left hand signal list and left-click>OK.
15. Left-click>Next.
Probe tests the measurement on the first data section to see if the measurement is valid for this trace. It will also mark data points 1 and 2.
16. Left-click either the Next or Finish buttons to complete the wizard and display the results of the measurement.
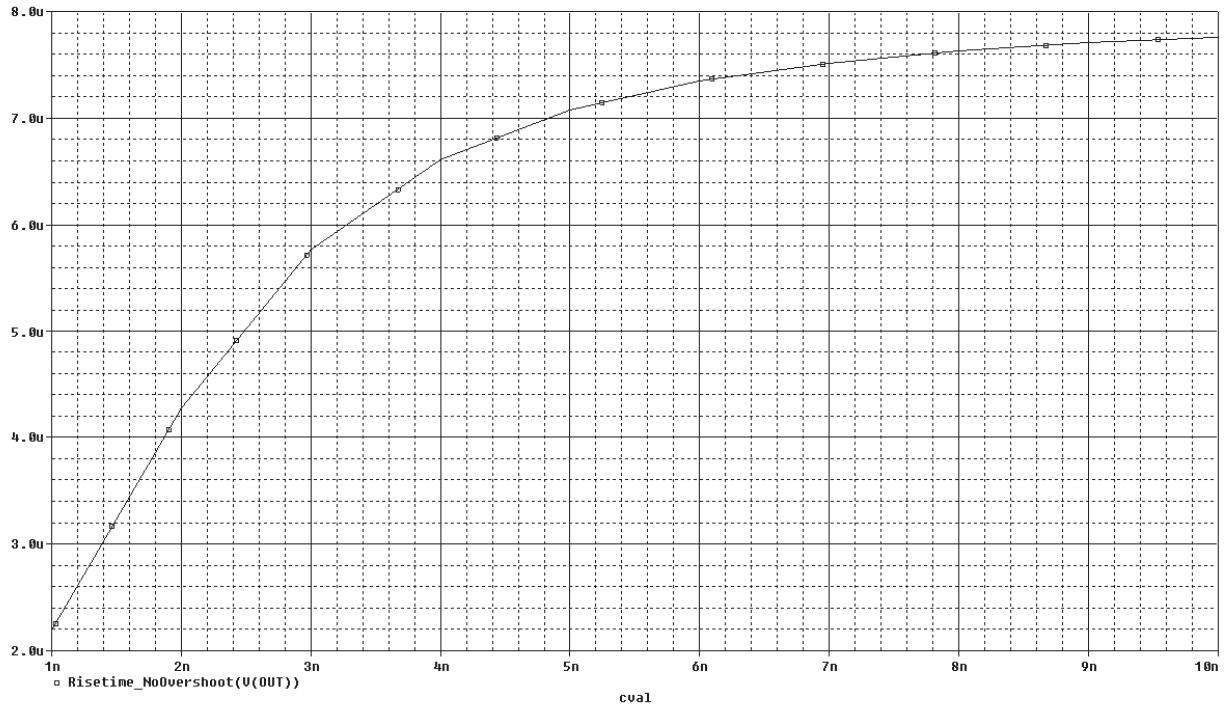
We can see that the rise time increases as the value of the capacitor increases.
If you want to see the actual data points used to create the curve choose Tools>Options and left-click on the Mark Data Points option.

End of Lab
All content Copyright 2022 Parallel Systems Ltd.