
All content Copyright 2022 Parallel Systems Ltd.
Reference Schematic:
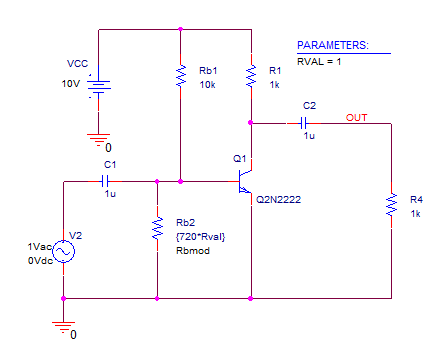
1. Open the WC project, File>Open>Project.
This circuit uses the VDC, R, Rbreak, C, 0 and Q2N2222 parts.
Note that Rb2 is a Breakout resistor.
Name the OUT net.
2. Edit the PSpice model for the breakout resistor to have the following definition:
.model Rbmod RES (R=1 dev=5%)
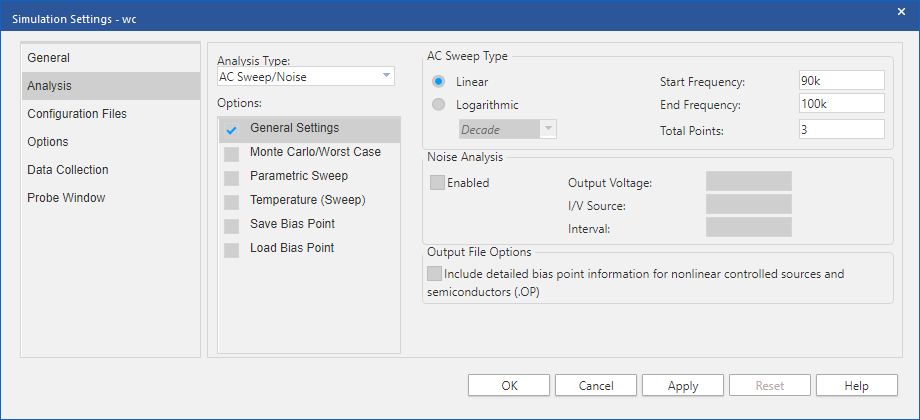
3. Create a simulation profile for an AC Sweep simulation analysis as shown in the graphic that follows.
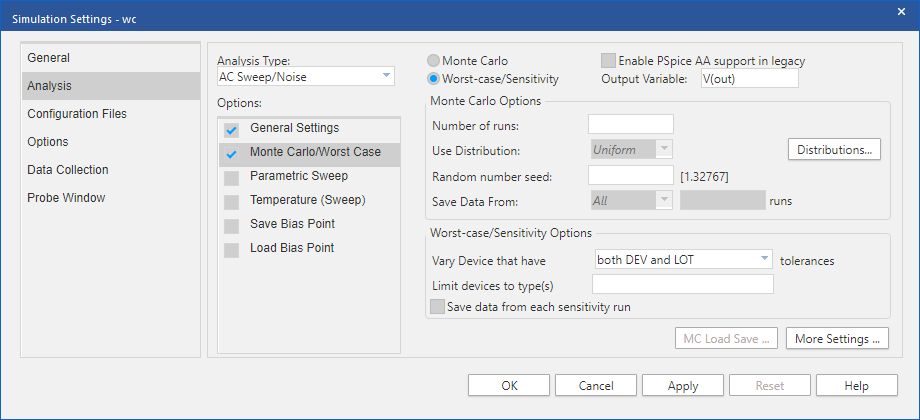
4. Configure a Worst-Case analysis as seen in the next picture.
5. Left-click>More Settings and configure the additional settings as shown in the next graphic.
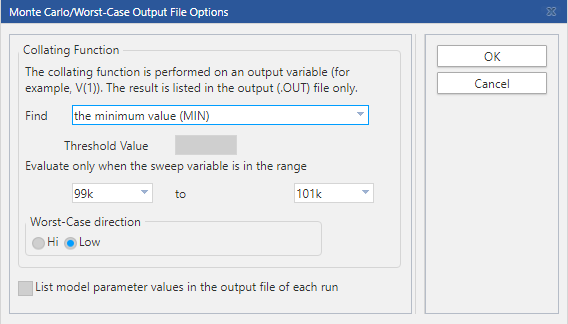
6. Left-click on the “OK”s to close the dialogs.
7. Run the simulation.
8. Examine the output file to see the worst-case result.
An excerpt from the file is below.
WORST CASE SUMMARY
******************************************************************
The range is ( 9.90000E+04 to 1.01000E+05)
RUN MINIMUM VALUE
WORST CASE ALL DEVICES
15.169 at F = 100.0000E+03
( 37.653% of Nominal)
JOB CONCLUDED
This is reporting that the result for the worst-case run is 15.169 at frequency = 100k.
Make a note of this value.
Now, move on to take a closer look at what is being displayed. A parametric analysis is going to be run on the resistor value to see that WC analysis will sometimes give us true worst-case and sometimes not.
9. Keep the Probe window open and go back to the schematic.
10. Create a new simulation profile, the AC sweep analysis will not change (a linear sweep from 90K to 110K with three points).
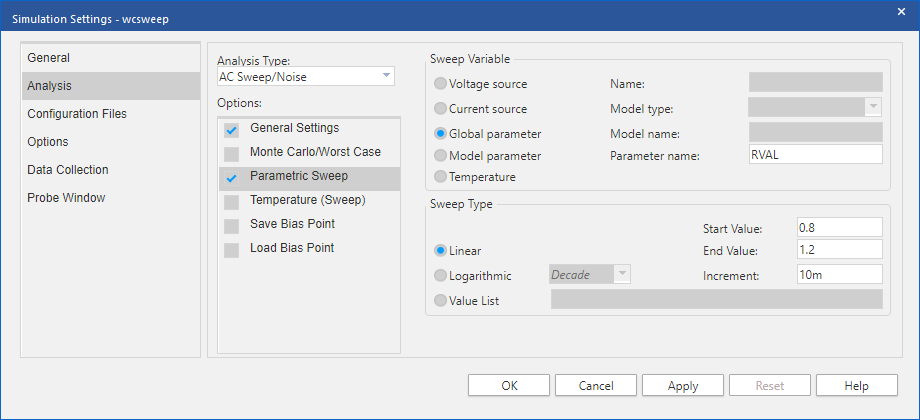
11. Set up a parametric analysis as shown in the graphic below:
12. Left-click>OK to save the settings and close the dialog.
13. Run the simulation and examine the results in the Probe window. A new tab is added to the Probe window for this profile.
14. Left-click the Performance Analysis toolbar button.
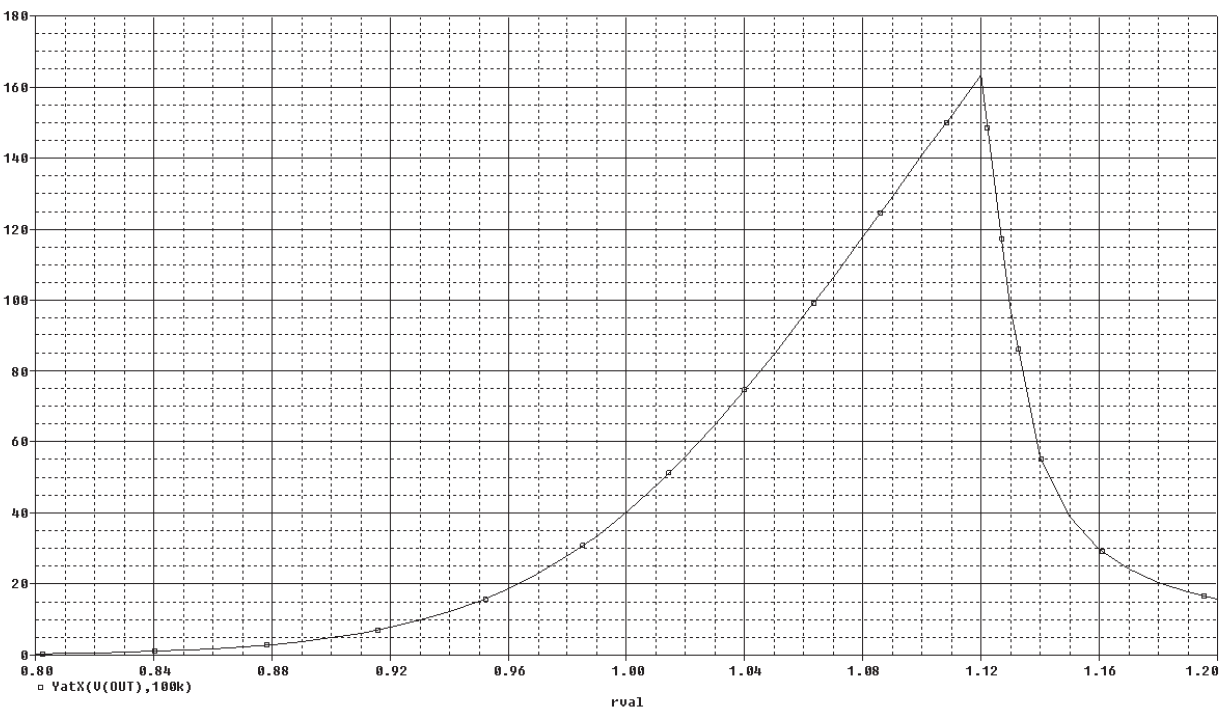
15. Add the trace YatX(V(OUT),100k). You should see the results as shown.
16. Turn on the cursors, Trace>Cursor>Display from the top menu
17. Left-click the Cursor Search toolbar button 
18. Type search forward level(15.169) in the Search Command field.
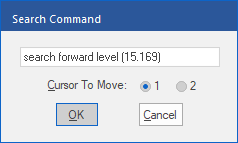
(To find the value from the Worst case run)
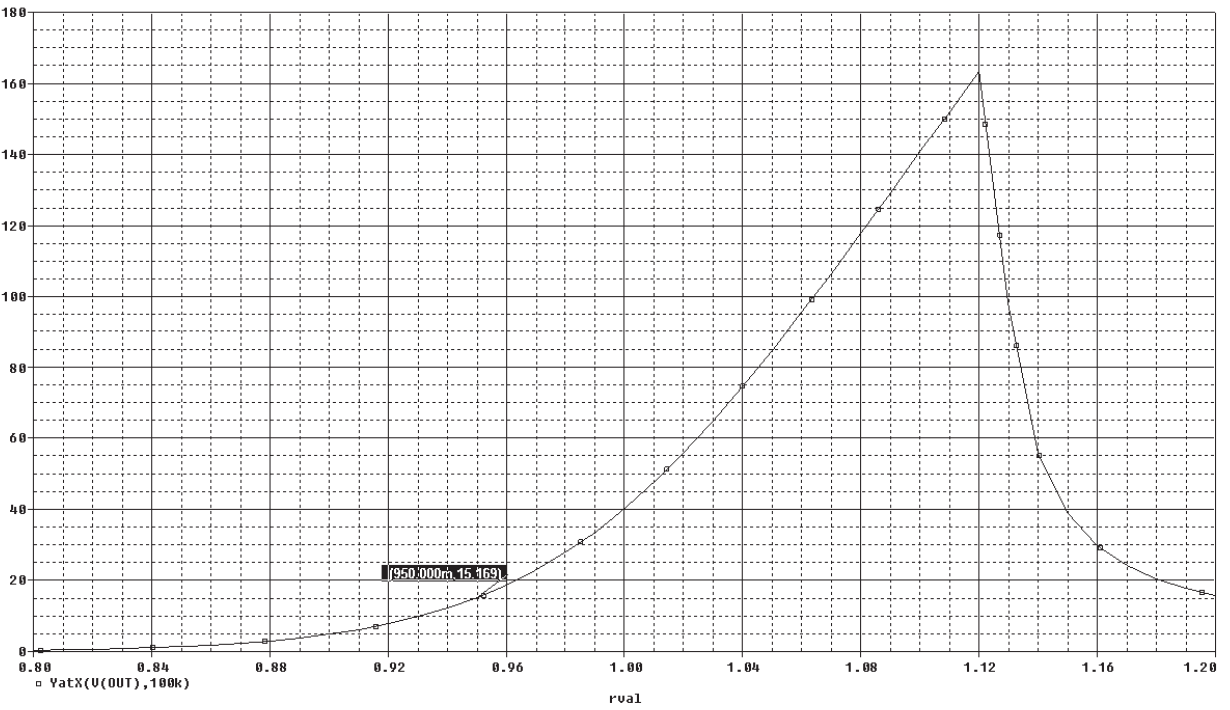
19. Left-click>OK to move the cursor to the specified point on the trace.
20. Left-click the Mark Label toolbar button to mark the point on the trace.
21. Looking at the trace, notice how the selected point really is the worst-case result in the + / – 5% value range.
(The 0.95 multiplier is equivalent to -5%, the minimum value from the tolerance)

End of Lab
All content Copyright 2022 Parallel Systems Ltd.